June 2026 Toronto Real Estate: The Market Is Back in Play
Toronto spent June watching the world's biggest football tournament unfold in its own backyard. The city hosted five World Cup matches that month, including the first-ever men's World Cup match on Canadian soil, and suddenly everyone was speaking fluent offside. But football was not the only thing heating up. The GTA real estate market quietly got back in play too.

After a painfully slow start to 2026, June delivered the clearest sign yet that buyer activity is gaining momentum. Sales jumped 9.4% from last June while new listings fell 12.9%. Active inventory was also down 13.5%, pulling the market to 4.04 months of inventory and increasing competition for the listings buyers actually want.
This is what the early stage of a market recovery looks like. Activity improves first. Inventory tightens next. Prices are usually the last player to enter the match.
The real story is not that Toronto real estate suddenly became hot again. It is that buyers stopped waiting. Homes that reflected today's market moved. Homes priced around yesterday's expectations stayed on the sidelines collecting days on market and increasingly awkward conversations.
June's Market in One Sentence
More buyers competed for fewer homes, but they still refused to overpay.
According to the Toronto Regional Real Estate Board, 6,770 homes sold across the GTA in June 2026, up 9.4% year-over-year. Active listings dropped to 27,329, down 13.5%, and months of inventory tightened from 5.10 last June to 4.04.
New listings fell 12.9%, which matters just as much as the sales increase. Demand strengthened while fewer properties entered the game. Sales during the first half of 2026 edged 1% above the same period last year, while available inventory remained significantly lower.
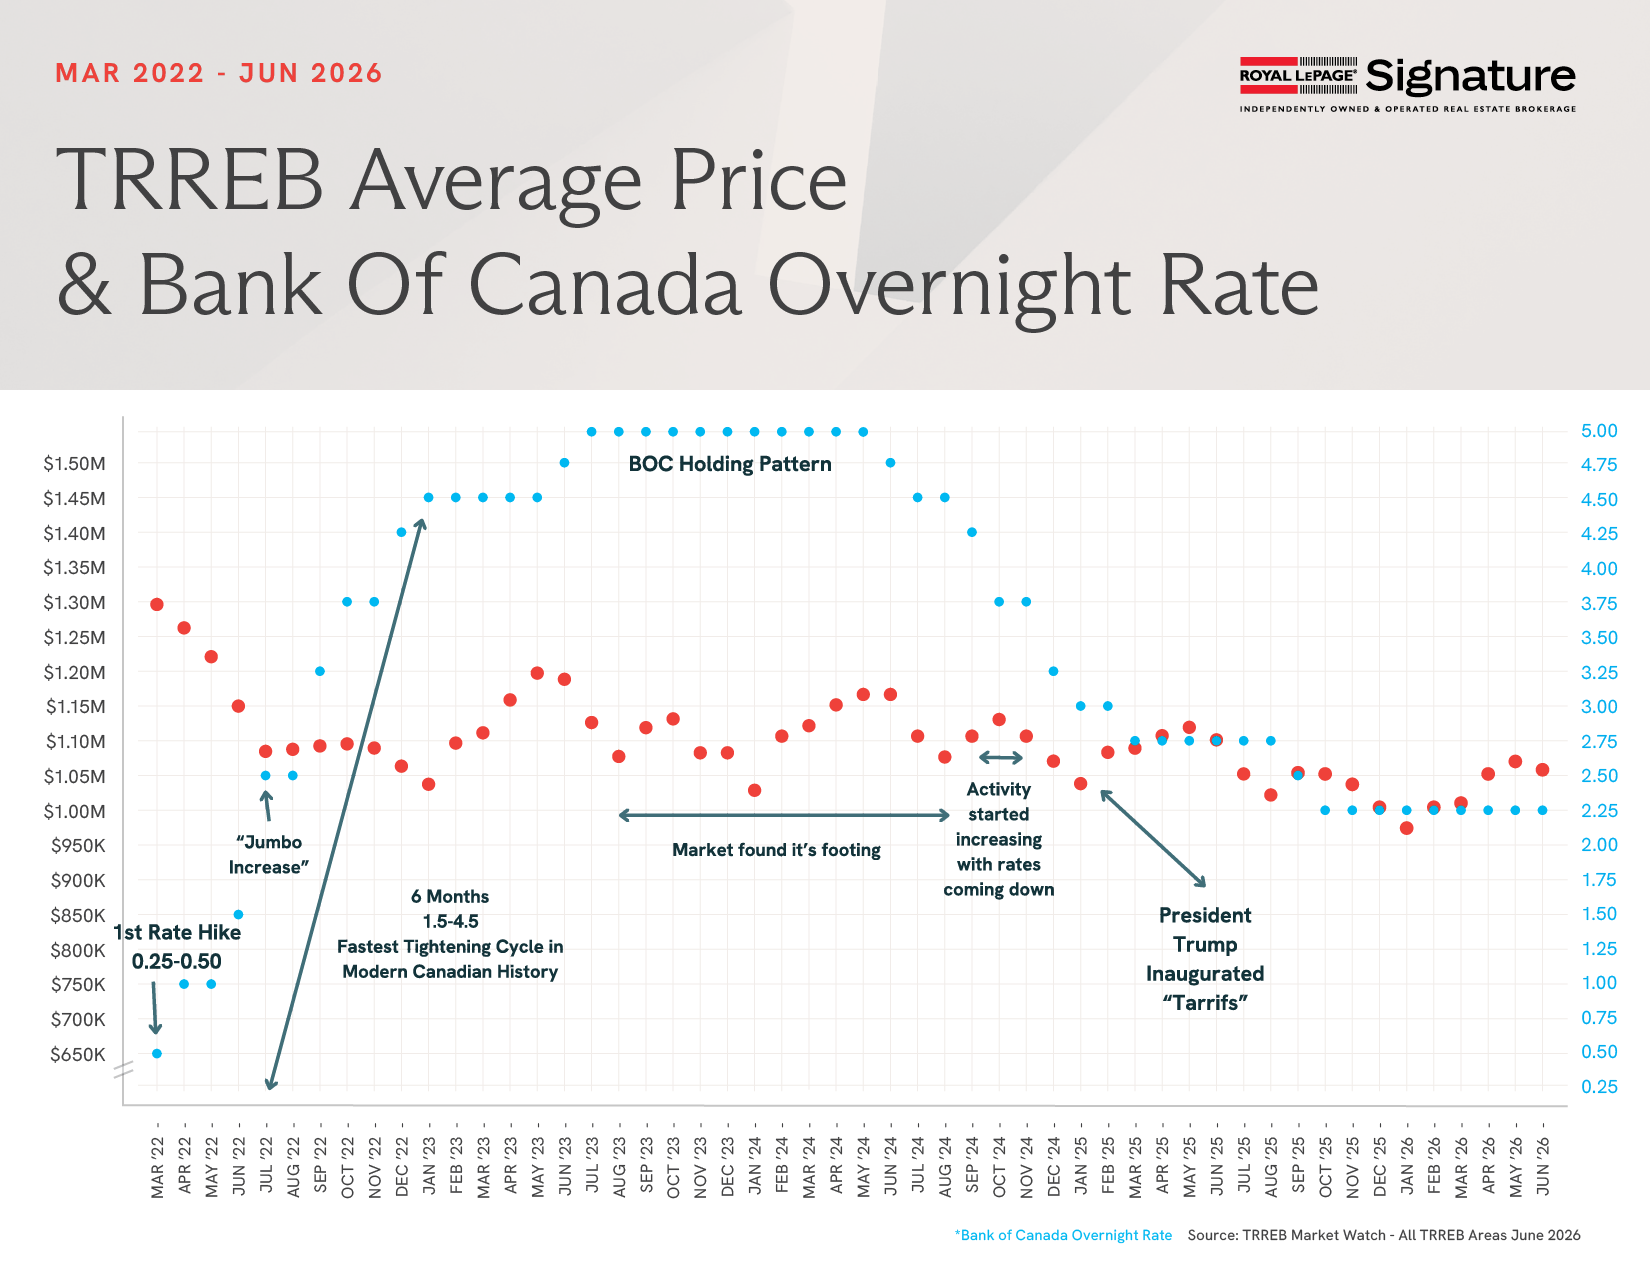
The average sale price came in at $1,058,658, down 3.9% from June 2025. The MLS Home Price Index benchmark was down 5.4%, confirming that the softer pricing was not only the result of a different mix of homes selling. However, on a seasonally adjusted month-over-month basis, both the average price and HPI edged slightly higher. Prices are still below last year, but the decline is losing momentum.

Meanwhile, the Bank of Canada remained in a holding pattern at 2.25%. Buyers did not get a shiny new rate cut in June. They moved anyway. After years of waiting for the perfect combination of lower rates, lower prices and total economic certainty, some buyers appear to have accepted that the market does not send engraved invitations.
TRREB Chief Information Officer Jason Mercer expects buyer activity to continue strengthening as confidence returns and pent-up demand is released. If sales keep rising while supply remains constrained, prices could level off and begin moving higher before the end of the year. That is the play to watch through the second half.
The market that spent all winter frozen and all spring quietly recovering has arrived somewhere new. Not hot. Not a seller's market. But tighter, faster, and less forgiving than it was six months ago. The sellers who priced for today showed up to a real market. The ones who priced for 2024 showed up to a very quiet open house.
Summer 2026 will be the test of whether this momentum holds or whether the seasonal slowdown interrupts the streak. Based on everything the data has said since January, betting against it looks increasingly difficult to justify.
Condo Buyers Step Back Onto the Field
The condo market produced the most important numbers in the entire report.
GTA condo sales rose 14.3% year-over-year to 1,714 transactions, while the average condo price fell 9.5% to $630,688. In the City of Toronto, condo sales also increased 14.3%, while the average price dropped 9% to $665,760.
That is exactly how a correction begins to work. Prices adjust enough to bring buyers back, transaction volume improves, excess inventory starts to clear, and only then does pricing stabilize.
This does not mean the condo market has recovered. There is still plenty of supply, investors remain under pressure, and buyers are scrutinizing maintenance fees, layouts, parking and building quality like never before. But June gave us the strongest evidence yet that lower prices are doing what lower prices are supposed to do: creating demand.
For condo buyers, the opportunity is still real. For condo sellers, the market is no longer dead, but it is brutally selective.
📍 GTA-Wide Scoreboard: More Sales, Less Supply
The year-over-year headline says prices are down 4.6%. That number is accurate but it is looking in the wrong direction. Month-over-month, the overall average price has climbed four straight months from $1,009,000 in January to $1,069,700 in May. Inventory dropped 13.3% year-over-year. MOI is down to 4.09. The market is not recovering in the headline sense. It may have found its floor. That is a different and more important conversation.
A quick note on the numbers: the Average Price (YTD) reflects January through May combined. The May monthly average of $1,069,700 is the more current snapshot.
Average Sale Price (Jun): $1,058,658 (▼3.9% YoY)
Average Price (YTD): $1,037,597 (▼5.2% YoY)
Sales (Jun): 6,770 (▲9.4% YoY)
Active Listings: 27,329 (▼13.5% YoY)
MOI: 4.04 → Balanced, Tightening
Average Days on Market (YTD): 31 (▲14.8% YoY)
Condo Sales (Jun): 1,714 (▲14.3% YoY)
Condo Avg. Price (Jun): $630,688 (▼9.5% YoY)
What this means: Buyers have less choice than they did a year ago, but they still have standards. Homes took an average of 29 days to sell, and the overall price remained below last year. This is a more competitive market, not an irrational one. Sellers need to earn the sale through accurate pricing, strong presentation and a property that makes sense beside the competition.
📍 Toronto Snapshot: Condo Buyers Rejoined the Match
Toronto recorded 2,443 sales in June, up 6.1% year-over-year, while active listings dropped 14.4% to 10,047. At 4.11 months of inventory, the city landed almost exactly on the line between buyer-friendly and balanced conditions.
Average Sale Price (Jun): $1,081,375 (▼4.7% YoY)
Average Price (YTD): $1,057,442 (▼5.0% YoY)
Sales (Jun): 2,443 (▲6.1% YoY)
Active Listings: 10,047 (▼14.4% YoY)
MOI: 4.11 → Balanced, Tightening
Average Days on Market (YTD): 31 (▲10.7% YoY)
Condo Sales (Jun): 1,124 (▲14.3% YoY)
Condo Avg. Price (Jun): $665,760 (▼9.0% YoY)
What this means: Toronto's condo recovery is being led by volume, not price. More buyers are transacting because values have corrected, but that does not give condo sellers permission to get ambitious. A great unit in a good building can sell well. An average unit priced above recent comparable sales will still disappear into the scroll.
📍 Mississauga Snapshot: The Steadiest Player on the Field
Mississauga came closest to flat pricing in June. The average sale price dipped just 0.5% year-over-year while sales increased 8.2% and active listings fell 10.9%.
Average Sale Price (Jun): $1,014,120 (▼0.5% YoY)
Average Price (YTD): $975,512 (▼5.1% YoY)
Sales (Jun): 567 (▲8.2% YoY)
Active Listings: 2,589 (▼10.9% YoY)
MOI: 4.57 → Balanced, Buyer-Leaning
Average Days on Market (YTD): 33 (▲17.9% YoY)
Condo Sales (Jun): 142 (▲14.5% YoY)
Condo Avg. Price (Jun): $525,333 (▼9.0% YoY)
What this means: Mississauga is quietly becoming one of the GTA's steadier markets. Overall prices are holding, sales are growing and inventory is tightening. The condo segment is still softer, but the 14.5% jump in sales suggests buyers are responding to value. Mississauga buyers still have negotiating room, but less of it on the best listings.
📍 Brampton Snapshot: Price Corrections Changed the Score
Brampton posted one of June's strongest activity gains. Sales jumped 11.6% while active listings fell nearly 20%. Prices, however, remained 6.7% below last year.
Average Sale Price (Jun): $888,203 (▼6.7% YoY)
Average Price (YTD): $886,655 (▼7.2% YoY)
Sales (Jun): 518 (▲11.6% YoY)
Active Listings: 2,122 (▼19.9% YoY)
MOI: 4.10 → Balanced, Tightening
Average Days on Market (YTD): 32 (▲23.1% YoY)
Condo Sales (Jun): 41 (▲64.0% YoY)
Condo Avg. Price (Jun): $431,720 (▼6.0% YoY)
What this means: Brampton is the cleanest example of buyers returning when the price makes sense. A double-digit sales gain beside a 6.7% price decline is not a mixed message. It is price discovery doing its job. The 64% increase in condo sales is eye-catching, but it comes from a small base, so nobody needs to release balloons. Still, demand is clearly improving.
📍 Oakville Snapshot: Two Very Different Games
Oakville was the only major market in this report where the average sale price increased year-over-year. Sales rose 16.5%, active listings fell 17.1%, and the average price edged 1% higher.
Average Sale Price (Jun): $1,454,094 (▲1.0% YoY)
Average Price (YTD): $1,472,292 (▲1.5% YoY)
Sales (Jun): 297 (▲16.5% YoY)
Active Listings: 1,196 (▼17.1% YoY)
MOI: 4.03 → Balanced, Tightening
Average Days on Market (YTD): 32 (▲10.3% YoY)
Condo Sales (Jun): 42 (▼17.6% YoY)
Condo Avg. Price (Jun): $694,402 (▼16.6% YoY)
What this means: Oakville's overall market is holding its value, but its condo market is telling a completely different story. A 16.6% condo price decline alongside falling condo sales suggests that this segment has not found its floor as convincingly as Toronto or Mississauga. Oakville is not one market. Premium freeholds are performing; condos are still working through a correction
📍 York Region Snapshot: June’s Breakout Performer
York Region led the GTA in sales growth, with 1,289 transactions, up 22.2% year-over-year. Active listings fell 11%, while the average price remained 6% below last June.
Average Sale Price (Jun): $1,169,958 (▼6.0% YoY)
Average Price (YTD): $1,153,033 (▼7.4% YoY)
Sales (Jun): 1,289 (▲22.2% YoY)
Active Listings: 5,302 (▼11.0% YoY)
MOI: 4.11 → Balanced, Tightening
Average Days on Market (YTD): 32 (▲14.3% YoY)
Condo Sales (Jun): 241 (▲17.6% YoY)
Condo Avg. Price (Jun): $587,584 (▼11.4% YoY)
What this means: York's price correction is pulling buyers off the sidelines faster than anywhere else in the region. Overall sales rose more than 22%, and condo sales jumped 17.6%, even as condo values remained 11.4% below last year. This is not price growth yet. It is the demand base being rebuilt.
📍 Durham Region Snapshot: Still Playing at Full Speed
Durham remained the GTA's most competitive major region at just 3.11 months of inventory. Sales rose 4.4%, active listings fell 9.7%, and homes continued to move faster here than elsewhere in the GTA.
Average Sale Price (Jun): $856,170 (▼3.7% YoY)
Average Price (YTD): $844,879 (▼6.4% YoY)
Sales (Jun): 849 (▲4.4% YoY)
Active Listings: 2,637 (▼9.7% YoY)
MOI: 3.11 → Seller-Friendly
Average Days on Market (YTD): 26 (▲23.8% YoY)
Condo Sales (Jun): 57 (▲11.8% YoY)
Condo Avg. Price (Jun): $483,250 (▼9.9% YoY)
What this means: Durham remains the market where buyers have the least time to overthink. Its combination of relative affordability and limited inventory continues to support demand, even though average prices are still below last year. Buyers can negotiate, but the good listings will not wait indefinitely while they hold a family meeting about paint colours.
The Final Whistle: What June Actually Tells Us
June did not mark the return of a seller's market across the GTA. It put the market back in play.
Sales rose. Inventory tightened. Condo buyers returned. Oakville held its value. York and Brampton proved that meaningful price corrections can unlock activity quickly. Durham remained competitive. Toronto moved closer to balance.
But prices were still down almost everywhere, and homes still took longer to sell than they did last year. That matters. Buyers are more active, not less discerning. They are willing to move when the property and price line up, but they are not rescuing overpriced listings out of civic duty.
📉 The buyer game plan: The period of maximum leverage is fading, especially for well-priced freeholds and the best condo units. There is still selection and room to negotiate, but inventory is shrinking and sales are improving. Waiting for a dramatic second price collapse is becoming a riskier strategy.
📈 The seller game plan: More buyers are in the market, but they are arriving with receipts. Pricing, presentation and positioning still determine whether you sell or become the listing everyone uses to justify an offer on something else. June rewarded realistic sellers. It did not reward hopeful ones.
Buyers are back on the field. Competition is building. Prices have not fully responded, at least not yet. If inventory keeps tightening, price stability should eventually follow. The second half of 2026 will tell us whether June was the opening match of a genuine recovery or simply one strong result.
One obstacle remains firmly in the way: affordability. Development charges can account for up to 20% of the cost of a new home, and industry leaders continue to push for reductions. Stronger resale activity is encouraging, but the GTA cannot build a healthier long-term market without confronting the cost of creating new housing.
If you want to know what these numbers mean for your neighbourhood, your building or your actual property, let's talk.
📲 No pressure, no jargon, just real strategy.
📩 hello@vanessacopeland.com
📞 Call or text anytime
👉 Book a consultation or get in touch to talk Toronto real estate