April 2026 Toronto Real Estate: The 3 Ps That Separate the Homes That Sell From the Ones That Sit
There are three things that determine whether your real estate transaction goes well this spring. Not the Bank of Canada. Not your neighbour's opinion. Not the guy at your cousin's wedding who "follows the market." Price. Property type. Presentation. Get all three right and April 2026 is your market. Miss one and you are the listing that becomes everybody else's cautionary tale.
The data backs this up hard. GTA sales are up 7% year-over-year. Listings are down 9.3%. Inventory has tightened to 4.22 months, the lowest reading since last summer. The spring market that everyone kept promising was coming has officially arrived. But it is not treating everyone equally and that gap comes down to the 3 Ps every single time.

According to TRREB's Chief Information Officer Jason Mercer, lower home prices and borrowing costs have been a catalyst for buyers this spring, but substantial pent-up demand still remains. More certainty on the trade front and an easing in geopolitical tensions would result in further improvements in market activity. Translation: this is the opening act, not the finale.
The GTA logged 5,946 home sales in April 2026, up 7% year-over-year, with an average selling price of $1,051,969, down 4.9% compared to April 2025 but edging up 3% from March on a seasonally adjusted basis. Condo sales jumped 9.1% year-over-year, the second consecutive month of positive condo sales data after a prolonged stretch of declines. The market is moving. The question is whether you are moving with it or still sitting on the sidelines waiting for the guy at the wedding to give you the all clear.
The 3 Ps: What Is Actually Moving the Market This Month
Price. The average selling price in April was $1,051,969, down 4.9% year-over-year but up 3% from March on a seasonally adjusted basis. Prices are stabilizing but they have not recovered. Sellers who are pricing to where the market was are sitting. Sellers who are pricing to where the market is are selling.
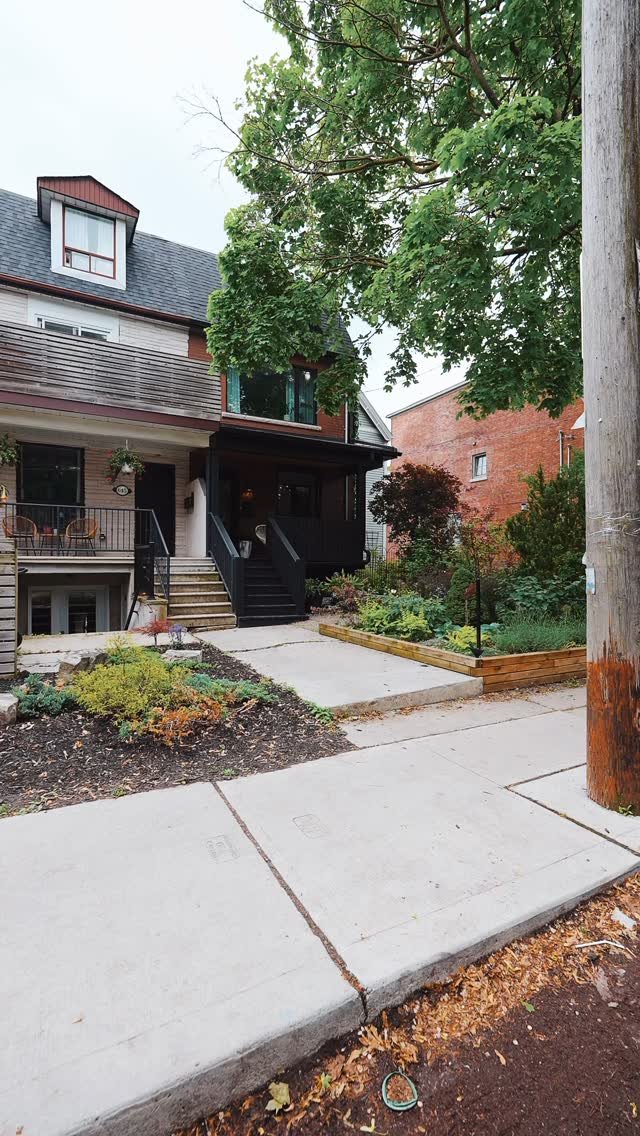
Property Type. All housing types saw increased activity in April, led by a 9.2% year-over-year increase in detached home sales, along with 9.1% more condo sales. Freeholds in the right locations are drawing competition. Condos are moving too, but selectively. The product type you are buying or selling matters more right now than the overall market headline.
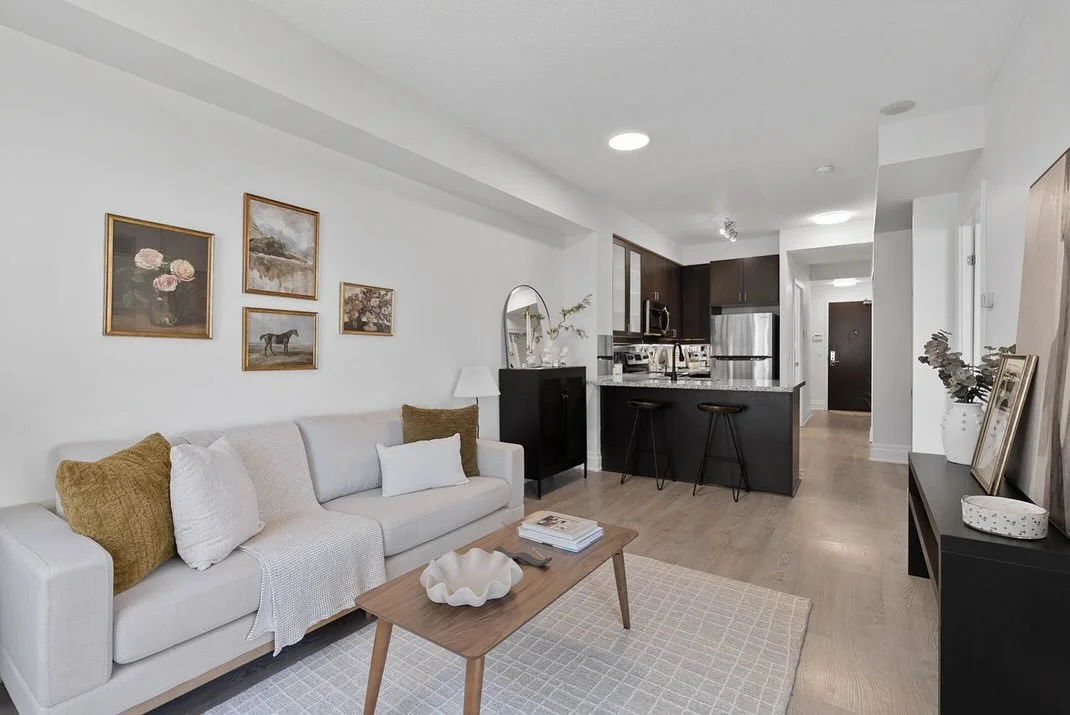
Presentation. Days on market are down to 29 across the GTA. The homes moving that fast are not moving by accident. Staging, photography, pricing strategy, and agent execution are doing real work in this market. The ones sitting at 60-plus days are the ones that skipped the prep and hoped the market would carry them.
This is the 3 Ps market. Get them right and spring 2026 works for you. Get them wrong and you will be watching other people's sold signs go up.
What This Means Heading Into Late Spring Market 2026
According to TRREB President Daniel Steinfeld, buyers have taken advantage of more affordable housing market conditions on the back of lower home prices. If market conditions continue to tighten and home prices level off, this could be a signal to intending homebuyers who remain on the sidelines.
The trajectory is clear. Second consecutive month of year-over-year sales gains. Inventory tightening for the fourth straight month. Condo sales up 9.1% GTA-wide. The window where buyers had maximum leverage is narrowing in real time and the sellers who act now, with the right price, right positioning, and right presentation, are the ones who will look back on spring 2026 as the moment they moved at exactly the right time.

📍 GTA-Wide Snapshot: Two Months of Gains and Counting
April marks the second consecutive month of year-over-year sales increases in the GTA. New listings declined 9.3% from April 2025, with just shy of 17,100 homes listed on the MLS system. Sales outpaced new supply, pushing inventory down to 4.22 months. The average price of $1,051,969 is down year-over-year but edged up month-over-month, which is the direction that matters right now.
A quick note on the numbers: the Average Price (YTD) reflects January through April combined. The April monthly average of $1,051,969 is the more current snapshot.
Average Sale Price (Apr): $1,051,969 (▼4.9% YoY)
Average Price (YTD): $1,018,849 (▼6.0% YoY)
Sales (Apr): 5,946 (▲7.0% YoY)
Active Listings: 25,110 (▼6.4% YoY)
MOI: 4.22 → Transitioning to Balanced
Average Days on Market (YTD): 34 (▲21.4% YoY)
Condo Sales (YTD): 1,553 (▲9.1% YoY)
Condo Avg Price (YTD): $635,653 (▼6.3% YoY)
What this means: Condo sales up 9.1% year-over-year is the headline inside this report. That is not a blip, it is two consecutive months of positive condo sales data after a prolonged period of declines. Volume is recovering before price, which is exactly how it is supposed to work. Sellers in the condo market who have been patient and realistic are now seeing movement. Buyers who have been waiting for the perfect condo at the perfect price need to understand that the field is getting more competitive by the month.
📍 Toronto Snapshot: 9.2% Sales Jump and Listings Falling Off a Cliff
Toronto had its strongest month of the year in April. Sales were up 9.2% year-over-year to 2,312 transactions, while active listings dropped 10.5%, the steepest inventory decline in the GTA. Condo sales jumped 14.4% year-over-year, the single largest condo sales increase of any region in this report.
Average Sale Price (Apr): $1,091,761 (▼4.6% YoY)
Average Price (YTD): $1,032,515 (▼5.4% YoY)
Sales (Apr): 2,312 (▲9.2% YoY)
Active Listings: 9,260 (▼10.5% YoY)
MOI: 4.01 → Approaching Balanced
Average Days on Market (YTD): 34 (▲17.2% YoY)
Condo Sales (YTD): 1,054 (▲14.4% YoY)
Condo Avg Price (YTD): $665,507 (▼6.4% YoY)
What this means: Toronto is knocking on the door of a balanced market at 4.01 months of inventory, a number that would have seemed impossible six months ago. The 14.4% condo sales jump is the data point that should get every condo buyer's attention: the window of low competition in Toronto's condo market is not as wide as it was in January. For sellers, the 10.5% listings decline means there is less competition on the supply side than at any point in recent memory. The 3 Ps are doing serious work in Toronto right now. The homes that have them are selling. The ones that do not are generating the 60-plus day averages that drag the stats down.
📍 Mississauga Snapshot: Holding Steady as the Market Tightens Around It
Mississauga posted a 6.6% sales increase in April while active listings dropped 3.2% and average prices came in at $980,653, down just 1.4% year-over-year. That is the smallest price decline of any market in this report and a meaningful signal that Mississauga's correction may be largely behind it.
Average Sale Price (Apr): $980,653 (▼1.4% YoY)
Average Price (YTD): $965,850 (▼6.0% YoY)
Sales (Apr): 516 (▲6.6% YoY)
Active Listings: 2,277 (▼3.2% YoY)
MOI: 4.41 → Buyer-Leaning, Tightening
Average Days on Market (YTD): 36 (▲28.6% YoY)
Condo Sales (YTD): 134 (▲0.0% YoY)
Condo Avg Price (YTD): $546,984 (▼0.7% YoY)
What this means: A 1.4% price decline in April is essentially flat. Mississauga's condo average of $546,984 is down less than 1% year-over-year and condo sales volume is holding at exactly the same level as last year. This market has found its floor. Buyers in Mississauga who have been waiting for a deeper discount are now competing with buyers who decided to stop waiting. The 3 Ps are critical here: a well-priced, well-presented property in Mississauga right now has a genuinely strong chance of a clean, competitive sale.
📍 Brampton Snapshot: Three Months of Sales Gains. The Story Writes Itself.
Brampton posted its third consecutive month of year-over-year sales growth in April, up 0.2% to 406 transactions. The number sounds modest but the context is everything: three straight months of positive sales in a market that was deeply negative through all of 2025. Active listings dropped 9.7%, the second steepest inventory decline in the report.
Average Sale Price (Apr): $885,936 (▼5.6% YoY)
Average Price (YTD): $885,119 (▼7.7% YoY)
Sales (Apr): 406 (▲0.2% YoY)
Active Listings: 1,960 (▼9.7% YoY)
MOI: 4.83 → Buyer-Leaning, Tightening
Average Days on Market (YTD): 34 (▲25.9% YoY)
Condo Sales (YTD): 21 (▼25.0% YoY)
Condo Avg Price (YTD): $421,376 (▼14.9% YoY)
What this means: The freehold story in Brampton is one of steady, quiet recovery. Three straight months of sales gains alongside falling inventory is not noise, it is a trend. The condo segment is the outlier: sales down 25% and prices down 14.9% tells you buyers in Brampton's condo market are still waiting for a clearer floor. For freehold sellers in Brampton, the 3 Ps are your playbook. Priced right, presented well, and matched to the right product type, this market is moving. The condo segment needs more patience.
📍 Oakville Snapshot: Price Up 8.2%. Read That Again.
Oakville's average sale price in April came in at $1,626,843, up 8.2% year-over-year. That is the only region in this entire report posting a year-over-year price increase and it is not a rounding error. Sales were up 14.4% and active listings fell 12.1%, the largest inventory decline in the GTA.
Average Sale Price (Apr): $1,626,843 (▲8.2% YoY)
Average Price (YTD): $1,443,177 (▼0.8% YoY)
Sales (Apr): 254 (▲14.4% YoY)
Active Listings: 1,161 (▼12.1% YoY)
MOI: 4.57 → Buyer-Leaning, Tightening Fast
Average Days on Market (YTD): 34 (▲17.2% YoY)
Condo Sales (YTD): 26 (▼29.7% YoY)
Condo Avg Price (YTD): $579,135 (▼16.2% YoY)
What this means: Oakville's freehold luxury market just posted the strongest month in this entire report. A 14.4% sales jump paired with a 12.1% inventory decline and an 8.2% price increase is a seller's market in everything but the official designation. The buyers who moved on Oakville freeholds in January and February got the best of the correction. The ones still waiting are now competing against a recovering market. The condo story is the contrast: sales down 29.7% and prices down 16.2% means Oakville's condo segment is still working through its inventory. Two very different markets inside one postal code.
📍 York Region Snapshot: Flat Sales, Falling Listings, Condo Volume Turning
York Region posted an 11.4% sales increase in April while active listings dropped 1.5% and the average price of $1,131,433 came in 9.9% below April 2025. The condo segment posted a 2.1% sales increase, a modest but directionally positive signal after months of declines.
Average Sale Price (Apr): $1,131,433 (▼9.9% YoY)
Average Price (YTD): $1,136,826 (▼7.9% YoY)
Sales (Apr): 994 (▲11.4% YoY)
Active Listings: 4,993 (▼1.5% YoY)
MOI: 5.02 → Buyer-Leaning
Average Days on Market (YTD): 34 (▲21.4% YoY)
Condo Sales (YTD): 194 (▲2.1% YoY)
Condo Avg Price (YTD): $620,637 (▼6.8% YoY)
What this means: York Region's 11.4% sales jump in April is a genuine surprise given how soft this region was through Q1. The price decline of 9.9% is still the steepest in this report, which tells you buyers are still shopping value here rather than chasing the market. The condo volume turning positive is the early sign that York Region's recovery is following the same pattern as the rest of the GTA: volume first, then price. At just over 5 months of inventory, sellers still need to lead with price and presentation to get a deal done. The 3 Ps are not optional in York Region right now.
📍 Durham Region Snapshot: 27 Days. Still the Fastest Market in the GTA.
Durham's days on market sit at 27, the lowest of any region in this report by a significant margin. At 3.29 months of inventory, it remains the only region firmly in seller-friendly territory. Sales were down 7% year-over-year but that is against the strongest prior year comp of any region in this report. Durham ran hot all of 2025. It is simply running at a more sustainable pace now.
Average Sale Price (Apr): $844,018 (▼7.4% YoY)
Average Price (YTD): $838,499 (▼7.5% YoY)
Sales (Apr): 708 (▼7.0% YoY)
Active Listings: 2,331 (▼1.1% YoY)
MOI: 3.29 → Seller-Friendly
Average Days on Market (YTD): 27 (▲28.6% YoY)
Condo Sales (YTD): 57 (▲18.8% YoY)
Condo Avg Price (YTD): $508,817 (▼6.8% YoY)
What this means: Durham condo sales up 18.8% while the overall market sits at 3.29 months of inventory tells you this market is genuinely healthy. Buyers are active across product types, inventory is constrained, and homes are moving in under 30 days on average. For buyers, Durham still offers the best value-to-speed equation in the GTA: affordable entry points with a competitive market that rewards preparation and decisiveness. The 3 Ps matter here too, but in Durham they are accelerants rather than requirements. A well-priced, well-presented home here is not just selling. It is selling fast.
What Does March 2026 Actually Tell Us?
Two consecutive months of year-over-year sales gains. Inventory tightening across every region. Condo sales positive GTA-wide for the second straight month. Oakville's freehold market posting a year-over-year price increase. Durham moving homes in 27 days. Toronto approaching a balanced market for the first time since the tightening cycle began.
This is not a boom. Prices are still down year-over-year across most of the GTA and the pent-up demand that Jason Mercer keeps referencing has not fully materialized yet. Trade uncertainty and geopolitical noise are real and they are keeping some buyers on the sidelines. But the buyers who moved in April did not wait for the fog to clear. They focused on the 3 Ps and they acted.

📉 For buyers: the window of maximum leverage is closing, not closed. You still have negotiating power in most segments and most regions. But the spread between a well-positioned property and a poorly positioned one is narrowing. The best opportunities right now are the ones where sellers have done the work and priced correctly. Those are the homes worth moving on quickly.
📈 For sellers: April confirmed that the 3 Ps are the difference between a sold sign and a price reduction. Price to the market that exists today, not the one you remember from two years ago. Choose your property presentation as if every buyer has seen ten other listings before yours, because they have. And work with someone who understands which product types and neighbourhoods are moving right now, because not all of them are moving the same way.
April proved that the 3 Ps are not theory. They are the receipts. The homes that got all three right sold. The ones that did not are still sitting on the market wondering what went wrong. That is the story of spring 2026. Not that the market came back. But that it came back for the people who showed up prepared.
If you want to understand exactly where your search or your property sits right now, let's talk.
📲 No pressure, no jargon, just real strategy. 📩 hello@vanessacopeland.com 📞 Call or text anytime
👉 Book a consultation or get in touch to talk Toronto real estate